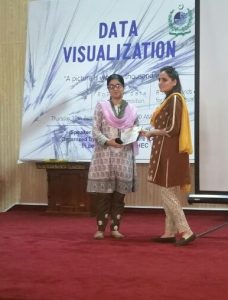
Seminar on Data Visualization By ITSC 2017
Seminar on Data Visualization By ITSC
Date: 10th AUGUST 2017
Venue: Auditorium
Department: ITSC
Speaker: Dr. Umer Shoaib Assistant Professor at University of Gujrat
Event Details:
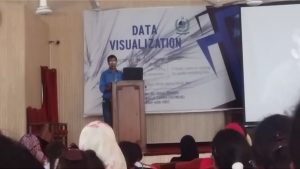
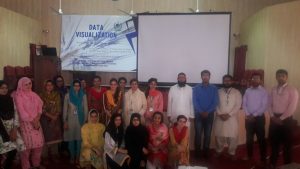
Department of IT Support Centre has arranged a seminar on 10th August 2017, on Data Visualization. The purpose of this seminar was to aware the students the importance and use of data visualization for analyzing big data for research purposes. The seminar was started at 10:00 a.m. with the recitation of Holy Quran and Naat-e-Rasool. Dr. Umer Shoaib was the chief guest of the seminar.
In the start of the program, the chief guest speaker explained the importance of visualizing big data in the form of graphs and charts. After giving a short historical background of graphs, the speaker explained the different understanding points of two dimensional and three-dimensional graphs.
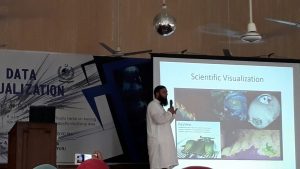
Mr. Imran Mazhar, LAN/WAN technician, explained the use of data visualization in developed countries i.e. U.S. he played some Videos of “Ted talks” on Multimedia for explaining the use of big data visualizing for comparison of the development of U.S in different years.
Mr. Adnan Ashraf, Web Master at ITSC, explained the importance and use of R Studio, which is a tool for visualizing big data sets of different types. He gave a detailed multimedia presentation on “how to install and use R Studio for data visualizing purposes. In this regard, he gave some examples of functions and queries that are used for fetching the required information from different types of data sets. He codded an example of analyzing social media’s big data for the purpose of voting purposes.
In the last, the guest speaker explained different research trends in data visualization.
Students showed interest in the seminar and also promise to act upon the procedure and advise by Presenters and Chief Guest.
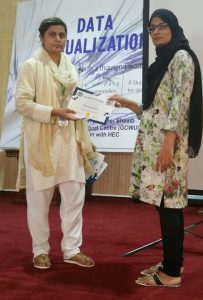
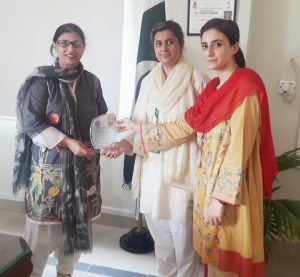
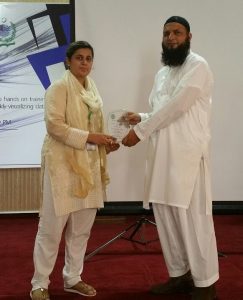
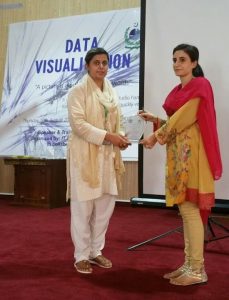
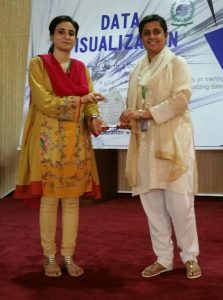
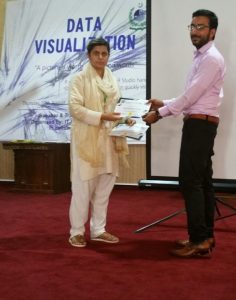
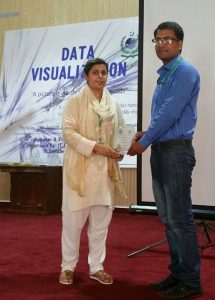
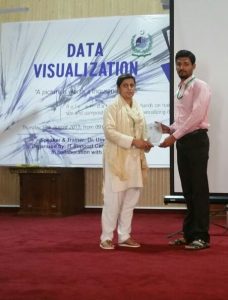
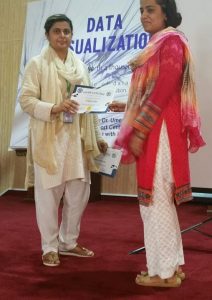
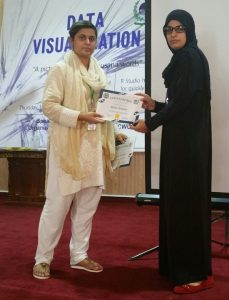
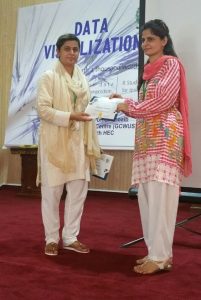
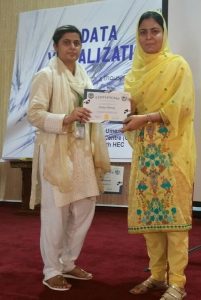
Certificates and shields are distributed to participants of the seminar and the organizer’s team of IT Support Centre.